Inventory Growth Reshaping Texas Housing Markets
Dallas • Fort Worth • Arlington
College Station • Bryan
Austin • Round Rock
Houston • The Woodlands • Sugarland
Dallas-Fort Worth-Arlington MSA
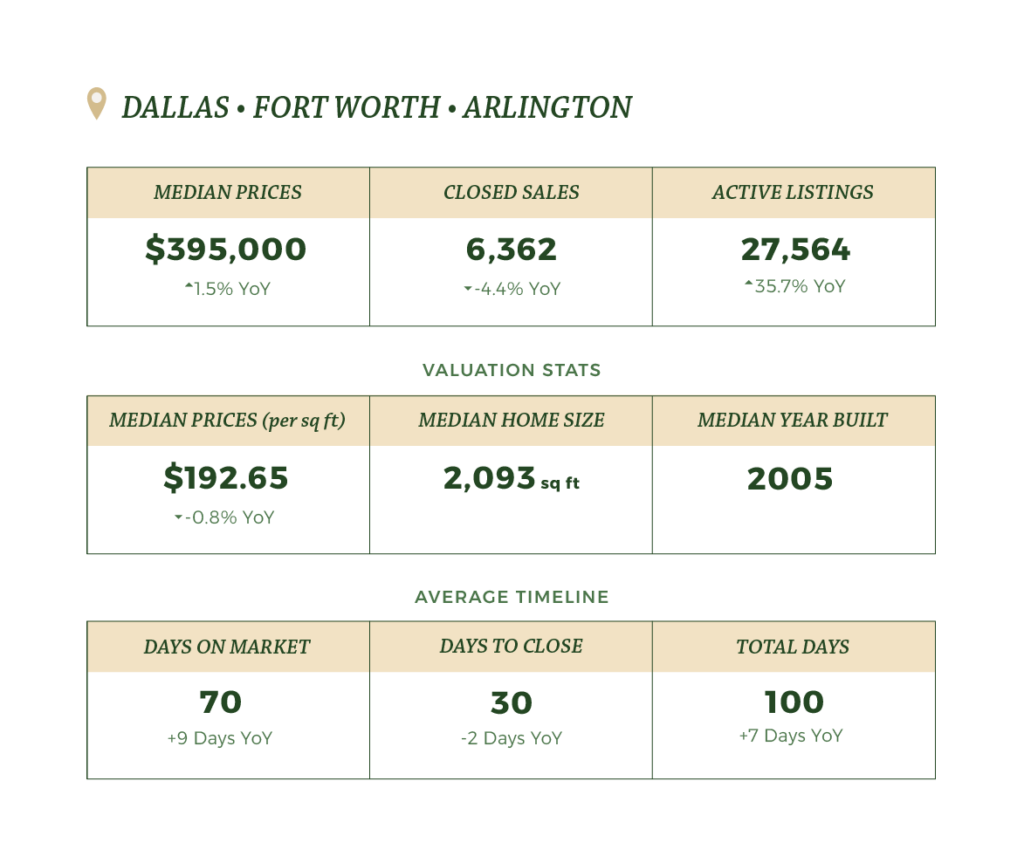
The DFW metroplex recorded 6,362 closed sales in February, experiencing a 4.4% year-over-year decline. Unlike other metros, DFW maintained slight price growth, with the median home value increasing 1.5% to $395,000. Active listings surged by 35.7%, bringing months of inventory to 3.6 months.
DFW buyers are taking more time to make decisions, with average days on market increasing 9 days to 70 days. Despite this extended timeline, properties are closing at 94.8% of original list price, suggesting realistic pricing from sellers.
College Station-Bryan MSA
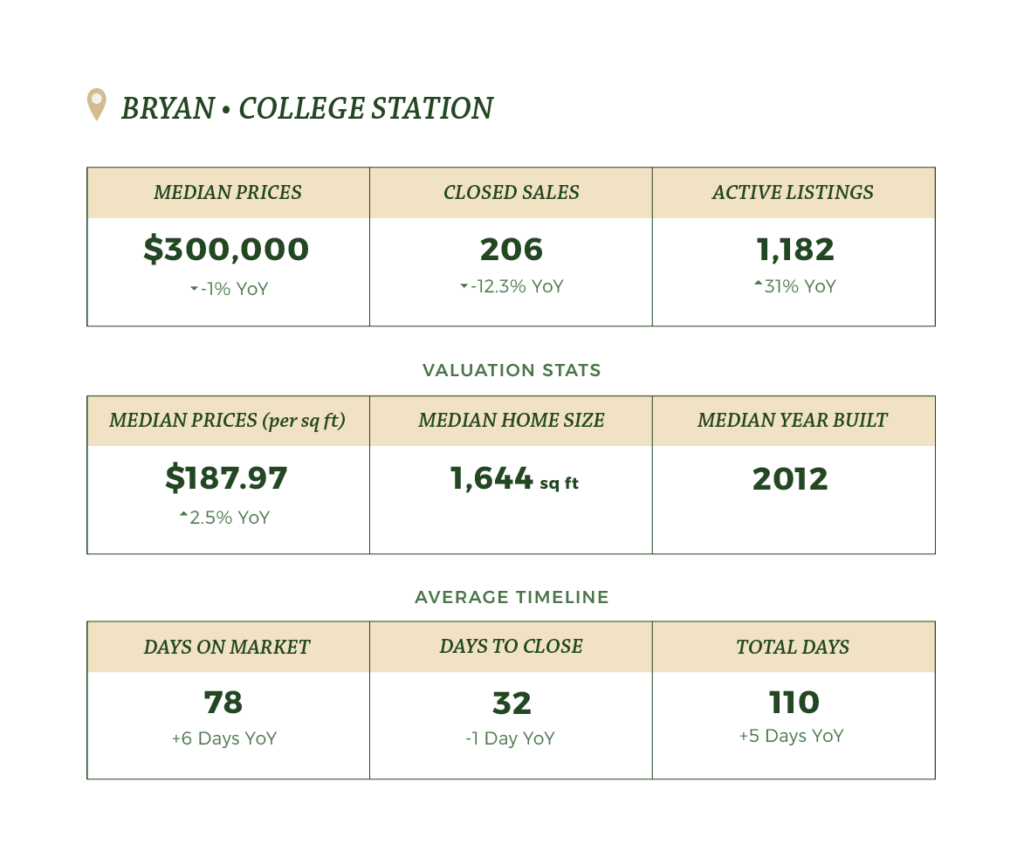
The College Station market recorded 206 closed sales in February, representing a 12.3% year-over-year decrease. The median price showed a slight 1.0% decrease to $300,000, while active listings increased by 31.0%, bringing months of inventory to 4.4 months.
College Station showed the highest close-to-original list price ratio at 96.7%, indicating efficient price discovery between buyers and sellers despite properties spending an average of 78 days on market (6 days longer than last year).
Austin-Round Rock-San Marcos MSA
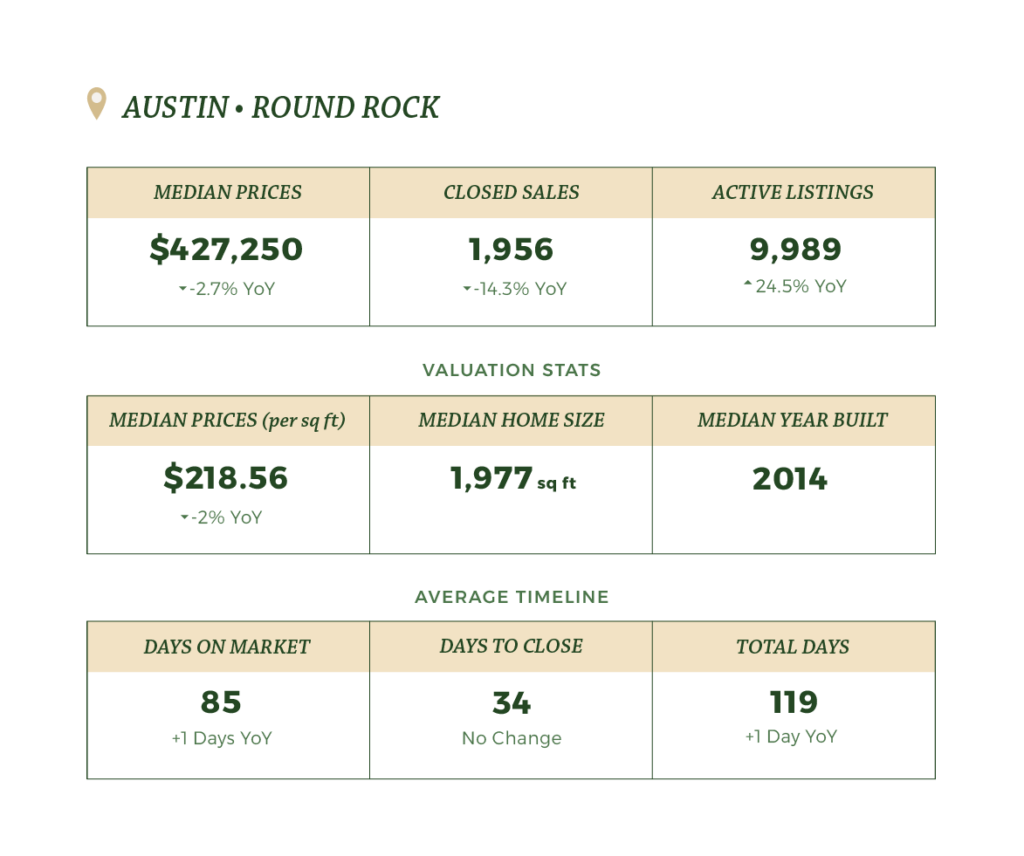
Austin’s market is showing signs of price correction, with the median home price declining 4% year-over-year to $410,000. Despite this, sales activity increased by 5%, and inventory levels rose to 3.6 months with active listings up 24.6%. The median price per square foot is $213.23, and homes are taking about 87 days to sell.

Houston-Pasadena-The Woodlands MSA
Houston’s market showed resilience with 6,102 closed sales in February, down just 3.5% from February 2024. The median home price settled at $325,000, representing a modest 1.4% year-over-year decline. Active listings have increased by 35% compared to last year, bringing months of inventory to 4.4 months.
Worth noting is Houston’s price distribution, with the majority of sales (71.3%) occurring in the $200K-$499K range. Only 9.4% of Houston transactions were priced below $200K (1.1% below $100K and 8.3% between $100K-$199K), while 19.2% of homes sold for $500K and above.
Average time on market remains relatively brisk at 58 days, just 2 days longer than last year, with transactions typically closing at 93.9% of original list price.
Market Analysis and Trends
Interest Rates and Affordability
Shifting Market Balance
Regional Economic Factors
Outlook
As we enter the traditionally active spring and summer seasons, the increased inventory levels provide buyers with improved selection and negotiating power. While closed sales have declined year-over-year, the market appears to be finding a new equilibrium rather than experiencing a severe correction.
The Texas Real Estate Research Center projects continued normalization throughout 2025, with the potential for transaction volumes to increase if mortgage rates decline further. The current market environment favors informed buyers and sellers who understand local conditions and price their properties in line with market realities.
Learn More
The Texas Real Estate Research Center is a valuable resource for real estate professionals, investors, and anyone interested in learning more about the Texas real estate market.