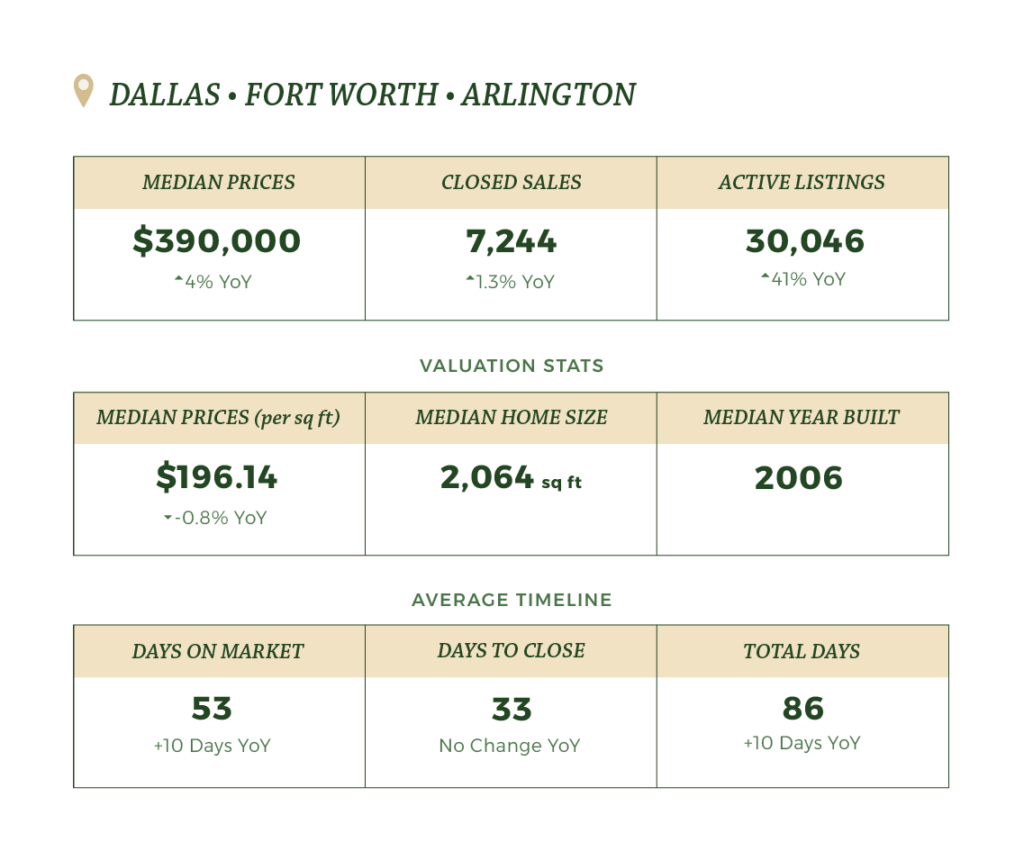
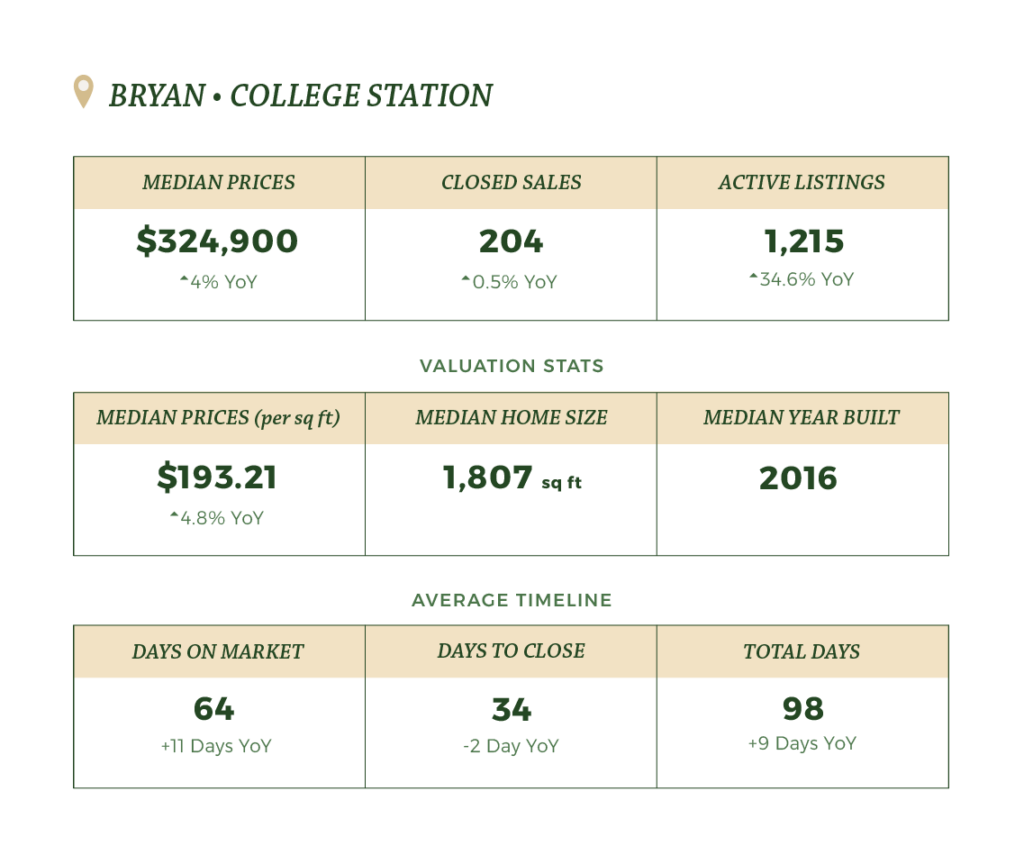
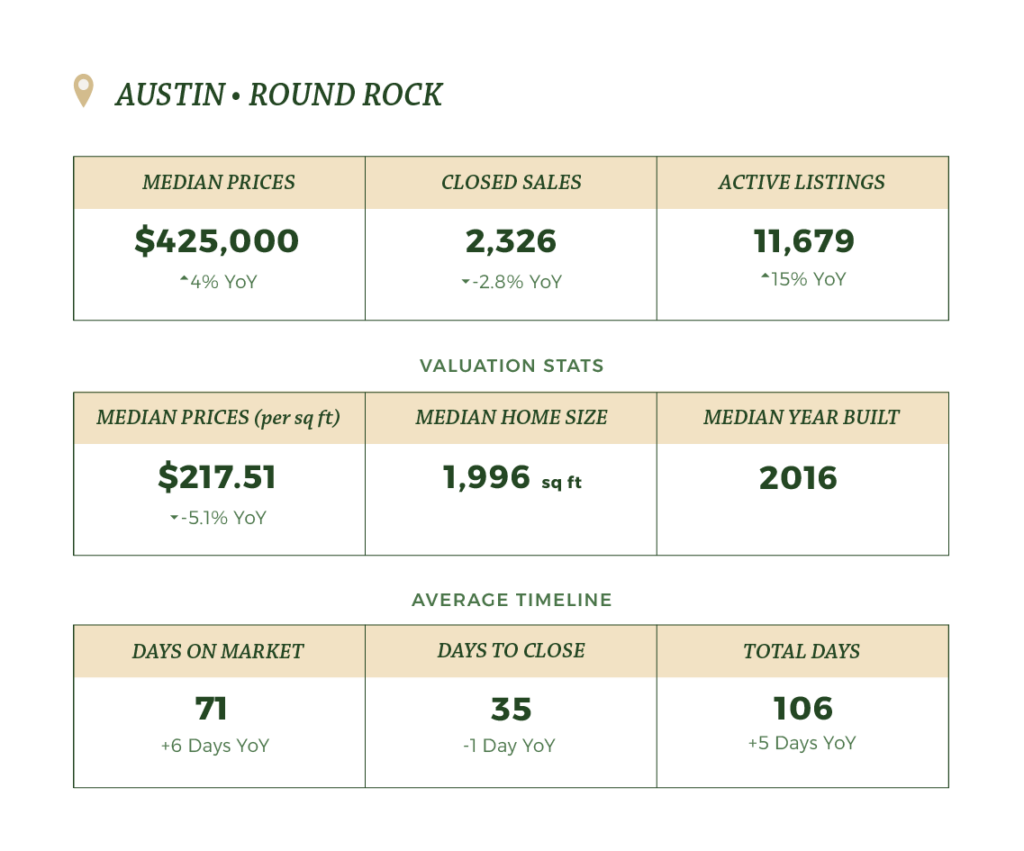
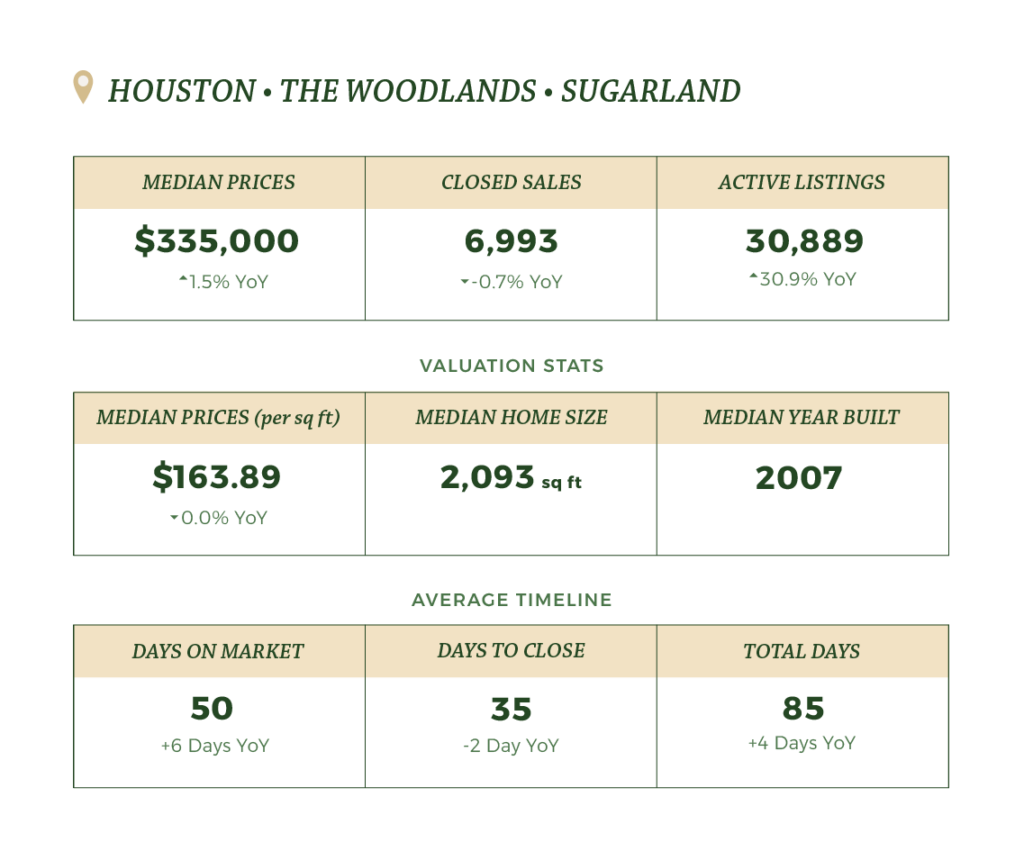
Housing Supply:

  • Texas housing supply has increased by 16% year-over-year
  • Current inventory stands at approximately 5 months of supply across the state
 

Demand:

  • Demand for Texas housing has decreased by 3.7% compared to last year
  • Price reductions on active listings remain consistent with the previous year
  • Properties are selling for approximately 97% of the asking price
 

Migration:

  • Net positive, with over 4,000 more people looking to move into Texas out of the state
 

Economic Outlook:

  • Further rate cuts may be necessary to significantly boost economic activity
  • Markets display optimism about the overall economic trajectory
  • The economy shows resilience, though growth is not particularly strong
  • Recent 50 basis point rate cut was beneficial but not transformative
  •  

Dallas • Fort Worth • Arlington
College Station • Bryan
Austin • Round Rock
Houston • The Woodlands • Sugarland

Learn More

The Texas Real Estate Research Center is a valuable resource for real estate professionals, investors, and anyone interested in learning more about the Texas real estate market.

Property Tax Consulting and Evaluations

Order a Free & Confidential Property Evaluation

Dallas • Fort Worth • Arlingtion

median price

$390,000

↑ 4% YoY

closed sales

6,673

↑ 1.3% YoY

active listings

22,586

↑ 41% YoY

Valuation stats

Median Price (sq/ft)

$196.14

↓ 0.8% YoY

median home sizes

2,064 sq/ft

- 0 YoY

median year built

2006

- 0 YoY

average timeline

days on market

54

+10 Days YoY

days to close

33

No Change YoY

total days

86

+10 Days YoY

Bryan • College Station

median price

$390,000

↑ 4% YoY

closed sales

204

↑ 0.5% YoY

active listings

1,215

↑ 34.6% YoY

Valuation stats

Median Price (sq/ft)

$193.21

↑ 4.8% YoY

median home sizes

1,807 sq/ft

- 0 YoY

median year built

2016

- 0 YoY

average timeline

days on market

64

+11 Days YoY

days to close

34

-2 Days YoY

total days

98

+9 Days YoY

Austin • Round Rock

median price

$425,000

↑ 4% YoY

closed sales

2,326

2.8% YoY

active listings

11,679

↑ 15% YoY

Valuation stats

Median Price (sq/ft)

$217.51

↓ 5.1% YoY

median home sizes

1,996 sq/ft

- 0 YoY

median year built

2016

- 0 YoY

average timeline

days on market

71

+6 Days YoY

days to close

35

-1 Days YoY

total days

106

+5 Days YoY

Houston •Woodlands • Sugarland

median price

$335,000

↑ 1.5% YoY

closed sales

6,993

0.7% YoY

active listings

30,889

↑ 30.9% YoY

Valuation stats

Median Price (sq/ft)

$163.89

- 0 YoY

median home sizes

2,093 sq/ft

- 0 YoY

median year built

2007

- 0 YoY

average timeline

days on market

50

+6 Days YoY

days to close

35

-2 Days YoY

total days

85

+4 Days YoY

What we do

Simplifying Your Real Estate Journey

Questions About Our Services?

More from Strider Journal:

Start Your Real Estate Journey Today

Latest from The Srider Jounral

May 2024 Market Reports

Welcome to your May Texas real estate update! We've compiled key statistics for major markets like Dallas, Austin, College Station, and Houston. Dive into essential market data including average sale prices, days on the market, and active listings. Get a head start with current insights on market activity and listing trends.

April 2024 Market Reports

We've gathered statistics for major areas including Dallas, Austin, College Station, and Houston. Dive into essential market data such as average selling prices, days on the market, and active property listings. Stay ahead of the curve with up-to-date insights on market activity and listing trends.

March 2024 Market Report

Welcome to your March snapshot of Texas real estate! We have covered statistics for the major areas such as Dallas, Austin, College Station, and Houston. Explore essential market data including average selling prices, the number of days on the market, and active property listings. Gain a competitive edge with up-to-date insights on market activity and listing trends.